The Sorghum QTL Atlas: A powerful tool for trait dissection, comparative genomics and crop improvement
A quantitative trait locus (QTL) is a locus (region of DNA) that correlates with variation in a quantitative phenotypic trait in a population of organisms. QTLs are mapped by identifying molecular markers (such as single-nucleotide polymorphisms [SNPs]) correlated with an observable trait. Thus, QTL analysis is a statistical method that links phenotypic data (trait measurements) and genotypic data (usually molecular markers) in an attempt to explain the genetic basis of the quantitative variation in complex traits. QTL analysis allows agricultural researchers to link certain complex phenotypes to specific regions of chromosomes, with the goal of identifying the effects, interactions, number, and precise locations of these regions (Miles and Wayne, 2008).
Sorghum breeders are always on the lookout for populations that have QTL data for specific traits of interest. However, they might also have related questions, including:
- Which other QTLs map near the loci associated with those traits, and might be affected by selection targeting them?
- How often has a particular QTL been identified in other studies or populations?
- What is the QTL with largest effect size identified for their trait(s) of interest?
- How many GWAS studies (as opposed to standard QTL mapping studies) have been undertaken for the trait(s) of interest?
- Which genes are within the QTL confidence interval (CI) for their target trait in sorghum, as well as in the syntenic locations in maize and rice?
- Which genes within a QTL CI of interest are under selection in sorghum, maize, and rice?
In a 2018 publication (Mace et al, 2018), Dr. Emma Mace and collaborators at the University of Queensland and Research Facilities of the Department of Agriculture and Fisheries of Queensland described the creation and use of the Sorghum QTL Atlas (https://aussorgm.org.au/sorghum-qtl-atlas/). This resource is a research platform comprising data from over 150 QTL and GWAS studies for 223 unique traits classified into seven broad categories, modified from the study by Mace and Jordan (2011): leaf, maturity, panicle, abiotic resistance, biotic resistance, stem composition, and stem morphology. Data can be queried by trait, genomic or syntenic location, study, or various study details. In turn, traits can be looked up by trait description, category, or subcategory. For example, in order to search for QTLs associated with grain weight, users can enter the search term “Grain weight” in Trait Description, select the Trait Category “Panicle” or Trait Subcategory “Grain & Panicle Yield,” or search for grain weight–related traits in the Trait Description options.
The QTL and GWAS data in this resource were collected from papers about sorghum published over the last two decades, and include genomic location, allelic effects and epistatic interactions for the quantitative traits. Before the resource became available, such QTL information had not been fully exploited by sorghum improvement programs and sorghum genetic researchers worldwide. In part, this was due to the heterogeneous nature of QTL studies, which leads to variable reliability of QTLs identified from one study to the next. To project QTL locations from multiple experiments onto a single genetic or physical map, it was necessary to take into account the factors on which the reliability of the initial QTL study depended. Using such approaches to adjust the QTL CI, the authors collated the projected locations of ~6000 significant QTL or GWAS loci from ~150 publications about sorghum published between 1995 and 2018, expanding on a previous study by Mace and Jordan (2011), including 35 major effect genes from Mace and Jordan (2010). QTLs in the Sorghum Atlas are aligned to all existing Sorghum bicolor genome assemblies. The corresponding syntenic locations are predicted in maize (V2) and rice (MSU7). In addition, the resource provides links to the underlying genes in each species, as well as details about any previously identified signatures of selection. Genome coordinates for all QTL and major effect genes are given for all three versions of the sorghum genome assembly, for the sorghum consensus map, and for the syntenic locations on maize and rice. Additional background information about the Atlas is available on the website.
The database can be accessed by registering for a free account, and to browse regions with QTL data in the current SorghumBase release 2 (assembly v.3), you may use the physical or genetic (cM) coordinates kindly provided by the Sorghum QTL Atlas team.
Inclusion of QTL data in the database prior to publication of a new article can be arranged via the site’s contact form.
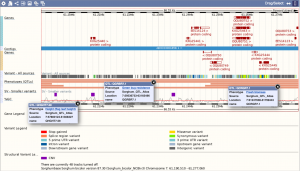
Example region in SorghumBase with QTLs associated with multiple traits including greenbug resistance, fresh biomass, and flag leaf height.
This resource facilitates the use of comparative genomics approaches to applied breeding.
